
How to send the diagnostic (log) files
There are three types of diagnostic files you can be asked to send to IDEA StatiCa support for investigation of a technical problem.
- IDEA StatiCa log files – logs of actions and errors during your work in apps, e.g., an error message appears when modeling a connection in the Connection app.
- Windows Event Viewer logs and Crash Dump files – system logs of app crashes, e.g., when your Connection app suddenly closes or doesn't open at all.
How to find IDEA StatiCa log files
Open the Windows File Explorer and copy/paste the following path:
%LOCALAPPDATA%\Temp\IdeaStatiCa\Logs
or manually navigate to the folder C:\Users\USER NAME\AppData\Local\Temp\IdeaStatiCa\Logs. In case you don't see the AppData folder, enable showing Hidden items in the Windows settings.

In the Logs folder, you can find several log files generated during previous actions made in IDEA StatiCa applications. Please put all of them into one archive file (either .zip or .rar) and send them to us via the User Portal (or your local reseller who provides the support to you).

The log files contain the events within the diagnostics files associated with your projects.
Setting the severity level of messages in the log files
Sometimes, it may be necessary to increase the level of logged details. To do so, please find the following file:
C:\Users\USER NAME\AppData\Local\IDEA_RS\IdeaDiagnostics.config
Open the IdeaDiagnostics.config file and change the severity level of messages in the log file (change the parameter in " " brackets in the DefaultLogLevel loglevel= line.
<IdeaDiagnosticsSettings>

	<DefaultLogLevel loglevel="Information"/>

</IdeaDiagnosticsSettings>
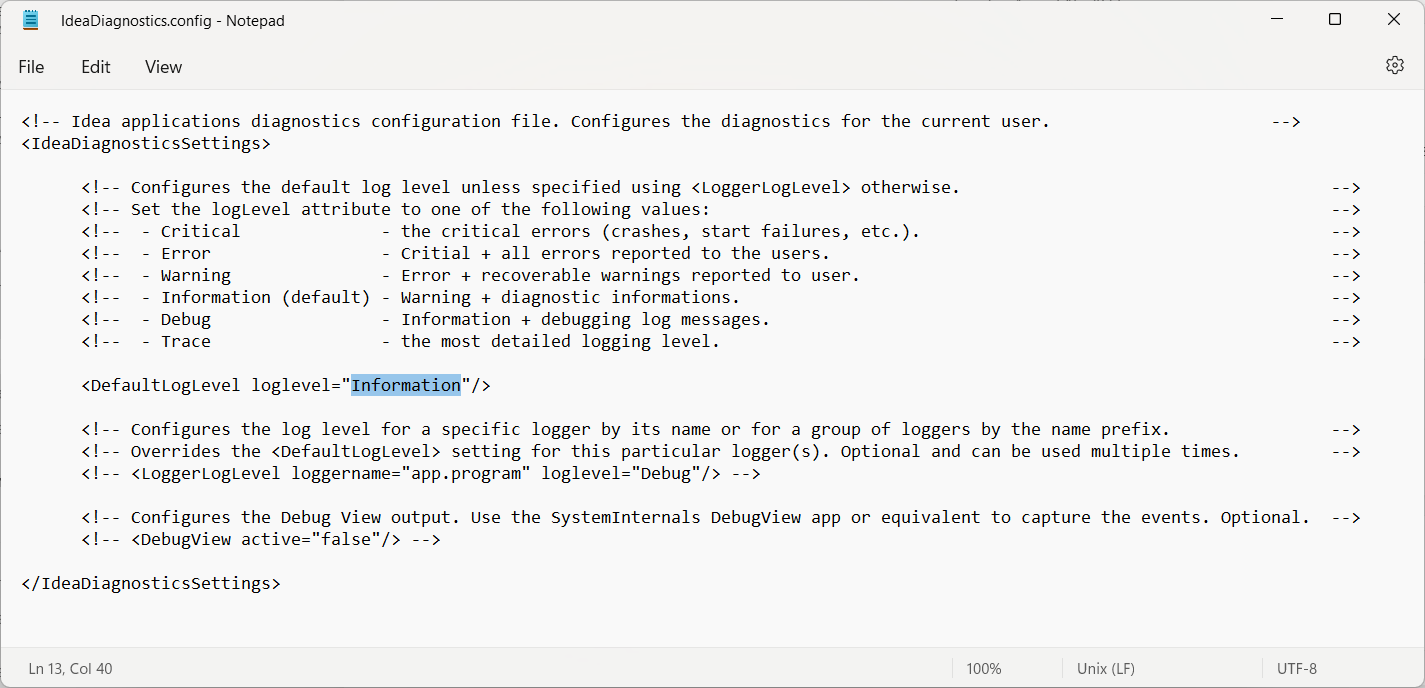
The default value of loglevel is Information. If it is changed to Debug or Trace, more details are written to the log file.
After you change the loglevel parameter and save the IdeaDiagnostics.config file, run the investigated action in IDEA StatiCa so that the problem occurs again and is written in the log files. After that, close the program and send us the new log files (described above).
How to collect the Windows Event Viewer logs
Some failures during application start-ups or shutdowns can be captured in the Windows Event Viewer logs. To export the logs, follow these steps:
- Open the Event Viewer from the Windows Start menu.
- In the left side panel, navigate to Windows Logs and open the drop-down menu.
- To export the Application logs, right-click on "Application", then select "Save All Events As..." and name the output file appropriately.
- To export System logs, right-click on "System", then select "Save All Events As..." and name the output file appropriately.

In special cases, you might be asked to export the remaining logs (Security, Setup, Forwarded Event). To export these logs, copy the previous steps.
How to capture the Crash Dump files
Additional information about the error can be available in the Crash Dump files. To collect the Crash Dump files for all applications on the computer:
- Download and unzip
WerDumpConfiguration.zip. - Create a folder
C:\Dumps. - Open
WerDumpCapturingOn.reg, confirm adding the Crash Dump collection into the Windows Registry Editor. - Reproduce the problem with the IDEA StatiCa application. Windows will automatically create a dump file in the folder
C:\Dumps\.
Please note the dump file may have several hundred MB in size, so please compress it into a .zip archive before sending it.
To disable collecting the Crash Dump files:
- Open
WerDumpCapturingOff.reg, confirm removing the Crash Dump collection from the Windows Registry Editor. - Remove the folder
C:\Dumps.

If you are using the IDEA StatiCa Open Model, please go to our GitHub repository.